 ELF Chart
ELF Chart

💛 Support Page Telegram directly
💳 Donate
Current Version: 2.0.0
6
Unique Views
2
Free Downloads
0
Donation Downloads
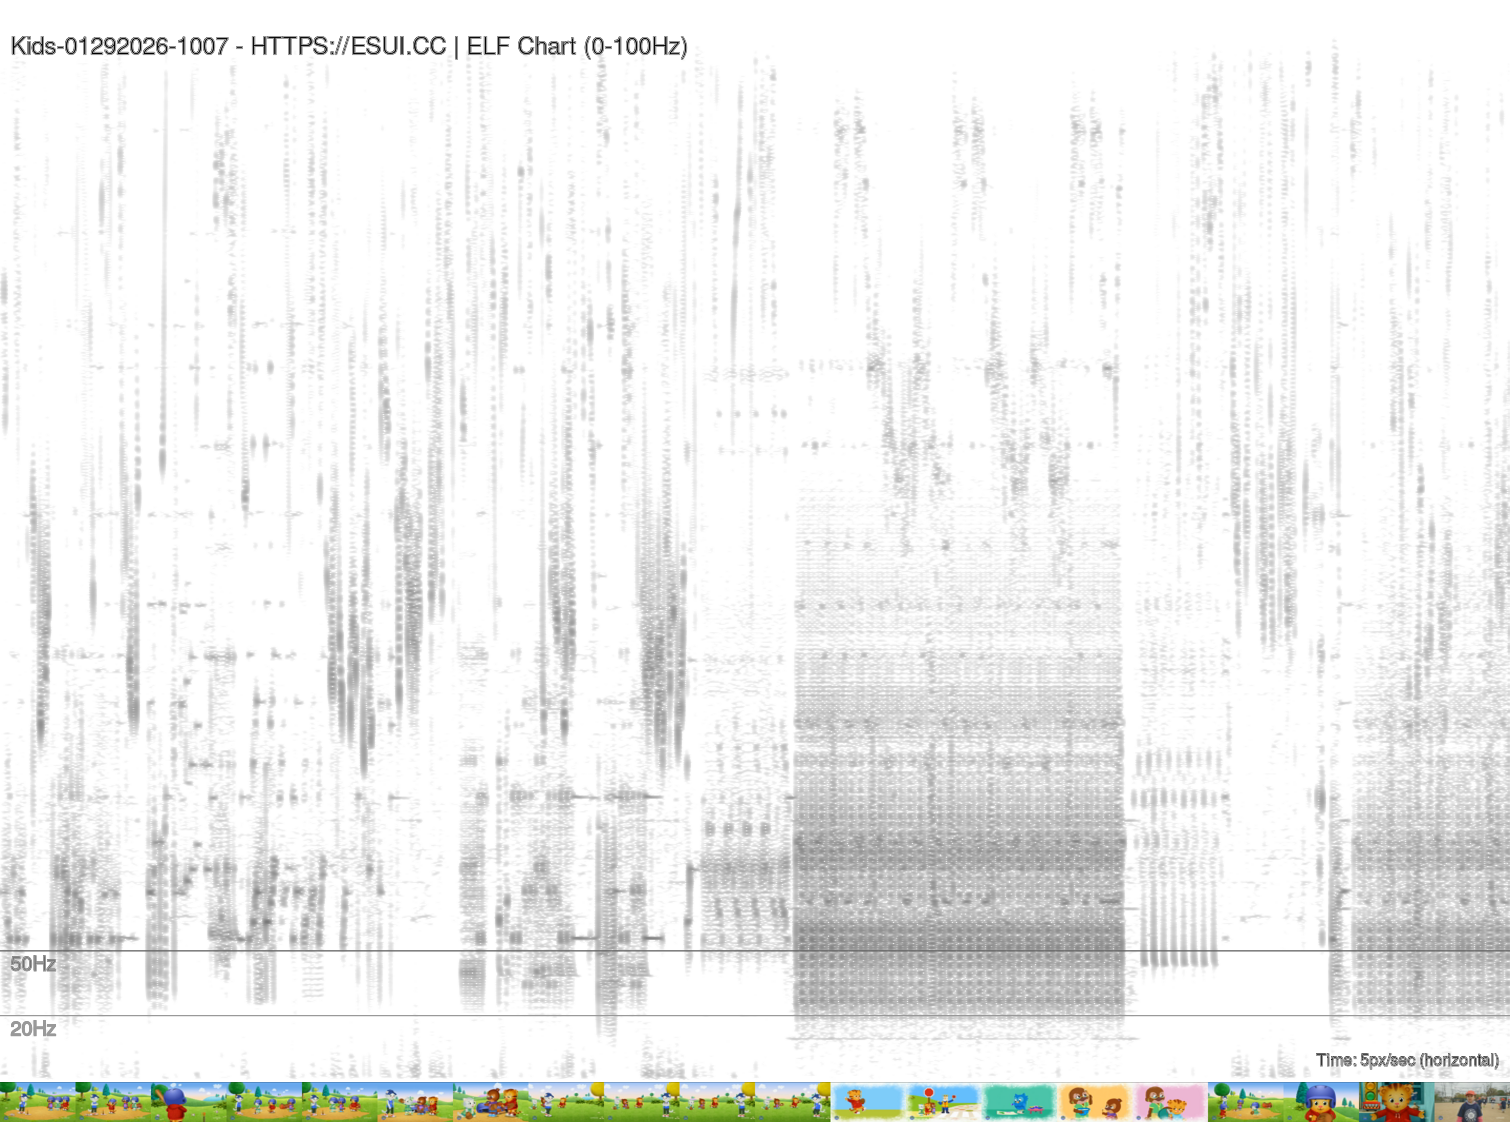
elfchart — ELF Spectrogram Chart Generator
Generates a black-on-white FFT spectrogram of the infrasound / extremely-low-frequency (ELF) range from video or audio recordings. Charts 5 pixels per second at 1080 px height, showing the FFT below 100 Hz with horizontal markers at 50 Hz and 20 Hz, and appends a source filmstrip at the exact time markers for visual context to infrasound artifacts. Uses SoX, ffmpeg, ImageMagick, and GNUPlot. ---Output
┌──────────────────────────────────────────────────────┐  ← 1080 px tall
│  filename — HTTPS://ESUI.CC | ELF Chart (0–100 Hz)  │
│  ── ── ── ── ── ── ── ── ── ── ── ── ── ── ── (50 Hz)│
│                                                      │  (black = high mag)
│  ·· ·· ·· ·· ·· ·· ·· ·· ·· ·· ·· ·· ·· ·· (20 Hz)│
│                                                      │
├──────────────────────────────────────────────────────┤  ← 2 px spacer
│ 🎞 🎞 🎞 🎞 🎞 🎞 🎞 🎞 🎞 🎞  (filmstrip thumbnails) │
└──────────────────────────────────────────────────────┘
  ← time (5 px/sec) →
- X axis — time (horizontal); default 5 px per second
- Y axis — frequency (vertical, 0 Hz at bottom, 100 Hz at top)
- Colour — pure black/white; black = high magnitude, white = low
- Markers — dashed lines at 50 Hz and 20 Hz labelled in grey
- Filmstrip — video thumbnails aligned to the same time axis, one frame per 72 px interval (one still every ~14.4 seconds at default PPS) ---
Dependencies
| Tool | Purpose |
|---|---|
| SoX | Audio resampling, low-pass filter, and raw FFT spectrogram generation |
| ffmpeg | Audio extraction from MTS/MP4 and video thumbnail extraction |
ImageMagick (convert, mogrify) | Frequency-marker annotation, label overlay, filmstrip compositing |
| GNUPlot | Fallback annotator when ImageMagick is unavailable |
sh
sudo apt install sox ffmpeg imagemagick gnuplot
Usage
elfchart.sh [OPTIONS] [FILE ...]
--dir) for .mts, .mp4, and *.wav files.
Options
| Flag | Long form | Default | Description |
|---|---|---|---|
-H | --height NUM | 1080 | Chart height in pixels |
-p | --pps NUM | 5 | Pixels per second on the time axis |
-f | --max-freq HZ | 100 | Maximum frequency displayed (Hz) |
-r | --sample-rate HZ | 1000 | SoX resample rate (Nyquist = rate ÷ 2) |
-w | --max-width PX | 8000 | Maximum output image width (ImageMagick policy guard) |
-d | --dir PATH | . | Directory to scan for media files |
-o | --output-dir PATH | . | Directory for generated PNG files |
-i | --interactive | — | Prompt for each setting; defaults shown in [] |
-h | --help | — | Print help and exit |
Examples
sh
Process every MTS/MP4/WAV in the current directory with all defaults

./elfchart.sh

Interactive setup — walks through every setting

./elfchart.sh -i

Single file, 10 px/sec, 720 px tall

./elfchart.sh -p 10 -H 720 recording.mp4

Batch scan a footage directory, write charts elsewhere

./elfchart.sh -d /mnt/camera -o ~/charts

Higher time resolution for a short clip

./elfchart.sh -p 20 clip.mts
How it works
MAX_FREQ, isolating the infrasound band.
-m -l -r).
Output files
Each input file produces one PNG named<filename>elfchart.png in the output directory.
---
Notes
MAXOUTPUTWIDTH ÷ PPS seconds the pixels-per-second value is automatically reduced to keep the image within the configured width limit.
OUTPUT_HEIGHT + 100 px to guarantee landscape orientation.
Download Options
Free Download: Source code is freely available below.
Compiled Versions: Support development with a PayPal donation.
Compiled Versions: Support development with a PayPal donation.
Free Downloads
📦 Download Source CodeChangelog
No changelog available.